MAY 1, 2024 | Rayliant

The U.S. economy continued surprising to the upside in Q1, with building confidence in the “soft landing” narrative and strong corporate earnings, leading stocks to rally through the end of March. Against that backdrop of “risk-on” sentiment, we found ourselves—like other data-driven investors—drawn to similar positive surprises in first-quarter U.S. inflation: a development set to derail markets’ expectations for a smooth pivot to Fed easing. Below, we highlight themes and data the team at Rayliant is following heading into Q2, along with their potential implications for the economy and markets.

Rayliant Global Advisors is a global investment manager with offices in Los Angeles, London, Hong Kong, Hangzhou and Taipei. With over US$15-billion in assets linked to Rayliant's strategies, its clients include some of the world's largest sovereign wealth funds, pension plans, and other institutional investors. Rayliant's award-winning team is an independent advisor to East West Bank regarding global economies and markets. East West Bancorp, Inc. (the parent company of East West Bank) holds a 49.9% stake in Rayliant Global Advisors.
Quarterly Commentary: Asset Classes
Equities
The first quarter witnessed stocks around the world pick up right where they left off at the end of 2023: surging higher as investors doubled down on artificial intelligence, reacted to continuing evidence of the U.S. economy’s strength, and clung to hopes the Fed would follow through on three cuts tipped for the new year at December’s FOMC—finally easing off of a policy rate hovering at its highest in over two decades. As we will see, data throughout the quarter cut against that last theme, showing prices to be quite a bit stickier than policymakers were expecting, though equity markets shrugged off a relatively hawkish turn in the Fed’s tone by quarter’s end, closing markedly higher for the first three months of the year (see Figure 1).
Figure 1: Equity Market Performance (Returns as of 31 March 2024)
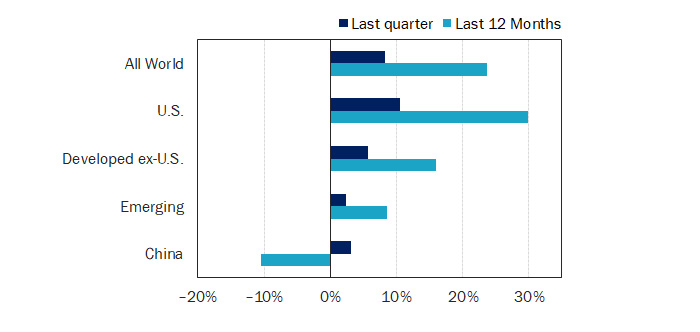
(Source: MSCI ACWI, S&P 500, MSCI World ex-USA, MSCI Emerging Markets, and CSI 300, all expressed in USD, except CSI 300 in CNY, via Bloomberg.)
Once again, U.S. stocks were among the strongest performers globally, adding 10.6% in Q1 on the back of strong corporate earnings, with shares of the so-called “Magnificent 7” up over 17% for the quarter. Developed markets outside the U.S. climbed by a respectable 5.8% in Q1, led by the world’s best-performing major market, Japan, whose Nikkei 225 index rallied 21.4% over the last three months, breaking the 40,000-yen mark for the first time ever and surpassing highs last hit in the late 1980s as wage growth, measured inflation, and signs of a return to expansion prompted the Bank of Japan to hike at its March meeting, finally putting an end to the nation’s negative-interest-rate policy. Emerging Markets gained a more modest 2.4% for the quarter, as concerns the Fed might delay easing weighed on economies generally more sensitive to U.S. rates and dollar strength.
Figure 2: Wall Street Still Seems More Dovish Than Fed Officials
The December FOMC brought with it a dovish pivot in Fed messaging, as the central bank's heavily scrutinized 'dot plots' showed a likely three rate cuts on the docket for 2024. Investors reacted by pricing in an even more bullish six cuts by year-end. Fast forward one quarter—with plenty of hot inflation data and what many perceived as a hawkish turn in Fed officials' tone over the intervening three months—and the FOMC's March revision to its rate forecast still showed a trio of cuts for 2024. We took the liberty of creating an equivalent dot plot for Wall Street analysts at the end of Q1, and while expectations have cooled off to a median three cuts, matching the Fed's, we still see more optimism than we feel is warranted in a fatter tail on the dovish end of the distribution.
Dot plot' projections for year-end 2024 Fed policy rate
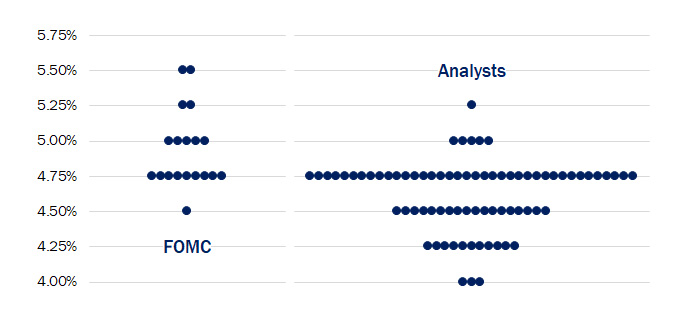
(Source: Rayliant Research, FOMC, Bloomberg, as of Mar. 25, 2024.)
Of course, even U.S. stocks should respond to changing expectations for the Fed’s policy path, and that is what we have typically observed over the last year or so, with markets often reacting strongly—and in the predicted direction—to not only Fed officials’ statements, but also evidence on consumer spending, updates on conditions in the labor market, and, naturally, data on inflation. Especially with respect to the latter category, the last few months have been full of upside surprises, suggesting that disinflation has stalled somewhat since we entered the year, leading Fed chair Jay Powell and others at the central bank to back off earlier signaling of an imminent pivot to easing. As we have suggested before, it was never clear to the U.S. that three cuts were a done deal for 2024, let alone the six cuts markets expected at the start of the year. In that sense, although we hoped for the best, it has been rather vindicating to see the consensus among professional forecasters move closer to our view (Figure 2), though investors’ optimism was such that stocks bucked the usual trend and rallied higher, despite a steady increase in end-of-year predictions for the Fed funds rate (Figure 3).
Figure 3: Rising Rate Expecations Couldn't Stop 'Risk-On' in Q1
Like many investors, we found ourselves in 2023 devouring macro data and hanging on Fed officials' every word in search of clues as to Fed policy, which seemed to drive performance in every part of our asset allocation. Stocks often appeared just as reactive as bonds to any change in expectations for terminal policy rates, with shares rising on dovish data and falling at any hint of 'higher-for-longer'. Oddly, despite mounting indications this year that a patient Fed will delay rate cuts in the face of sticky inflation, this familiar dynamic reversed at the start of Q1, with traders' forecasts of the Fed funds rate at year-end marching higher in parallel with a rally in rate-sensitive equities on the NASDAQ composite.
NASDAQ Composite level and futures-implied Dec. 2024 Fed funds rate, Jul. 2023 – Apr. 2024
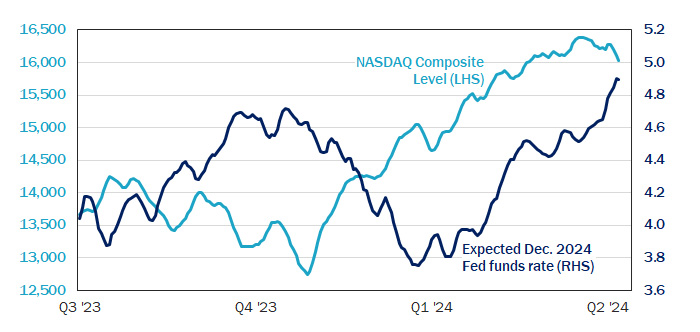
(Source: Rayliant Research, CME Group, as of Apr. 17, 2024.)
One story making the rounds at the end of the quarter was that stocks were rising because investors had rationally shifted attention from concern over the Fed’s timetable for easing to optimism that with the U.S. economy running so hot and corporate earnings apparently robust, a likely soft landing justified relatively lofty valuations. Such a view explains why, at the end of Q1, professional money managers’ positioning in futures-based bets on a continuation of the S&P 500’s rally had reached record levels (Figure 4). We agree that growth is surprisingly strong, especially in light of how high rates have gotten since the Fed started hiking, and this is undoubtedly a positive for stocks.
Figure 4: Fund Managers' Long Equity Bets Highest in Over a Decade
One way of quantifying money managers' enthusiasm over U.S. stocks is by looking at the magnitude of bullish bets they're making on the S&P 500 index. Data on trading in E-Mini futures on the S&P 500 index showed asset managers were net long to the tune of US$250 billion in early April, a record dollar amount of notional exposure. The S&P 500's price has also made record highs this year, though it's not just a surging index price pushing up the value of traders' bets: Even when calculated as a percentage of total open interest, long positions in U.S. stock futures are higher than they've been since contrarian bargain-hunters swooped in amidst the global financial crisis (those same value investors would likely note that the S&P 500 costs over 3.6x more today than it did then).
S&P 500 futures held long by asset managers as % of open interest, Jan. 2007 – Apr. 2024
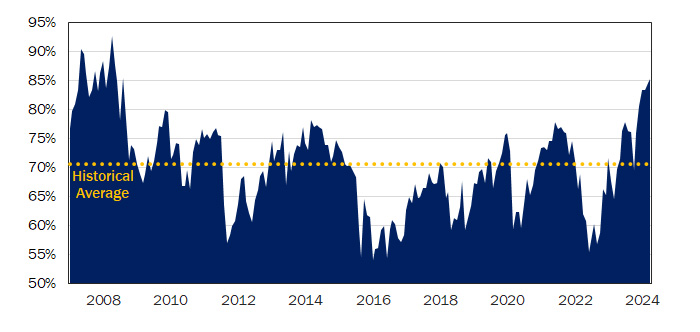
(Source: Rayliant Research, E-Mini S&P 500 Index futures contracts data via CME Group, CFTC, as of Apr. 17, 2024.)
On the flipside, we fear that today’s prices—especially in the case of U.S. stocks, and particularly within the technology sector, where much of the last year’s gains are concentrated—already reflect the good news. Moreover, the longer rates stay high because the Fed isn’t comfortable with progress against inflation, the greater the risk that policymakers inadvertently overshoot—in our view—leading the tide to suddenly turn on that growth critical in supporting such valuations. That’s why in seeking exposure to stocks, we have increasingly tended toward markets outside the U.S., including emerging markets, which still present plenty of upside in the event a soft landing is realized, but meanwhile trade at much more forgiving multiples. It’s also why we lean heavily on our ability to actively manage our portfolios’ compositions, selecting stocks for which we see higher quality and upside better balanced against risk. One risk to equities bubbling up at the end of Q1 was simmering tension in the Middle East threatening to boil over into a more disruptive conflict. While geopolitical conditions are certainly worth monitoring going into the second quarter, we note that investors sometimes focus too much on scary headlines at the risk of missing more substantive (albeit more mundane) sources of economic stress (Figure 5).
Figure 5: Geopolitical Fear Doesn't Always Trigger to Market Stress
An investor following the headlines in the first quarter might easily have concluded geopolitical tensions posed just as great a threat to asset prices as delays in Fed easing. Indeed, with war still raging in the Ukraine and an Israel-Gaza conflict which seemed on the verge of spilling over into the broader Middle East, there were plenty of military hotspots for investors to sweat. Perhaps reassuringly, a comparison of geopolitical stress measured from a textual analysis of newsprint with equity volatility captured by the VIX shows only a weak connection between geopolitical conflict and financial stress. Though market anxiety spiked modestly around major geopolitical shocks, the biggest disturbances arose from things like the global financial crisis, the European debt crisis, and the pandemic.
Historical indices of geopolitical and US financial market stress, Jan. 1985 – Mar. 2024
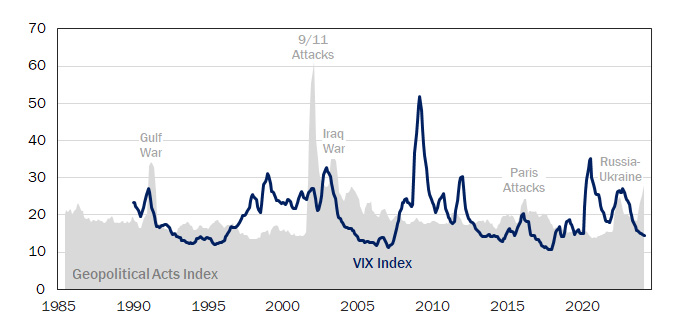
(Source: Rayliant Research, CBOE, Geopolitical Acts Index via D. Caldara & M. Iacoviello, as of Mar. 31, 2024. )
Fixed Income
After finishing 2023 with big fourth-quarter gains on a dovish change in the Fed’s posture, fixed income generally sold off in the first few months of the new year as central bankers walked back some of that optimism around a quick shift to a more accommodative stance (see Figure 6). Consistent with greater perceived odds of a soft landing, riskier bonds—e.g., corporate credit, high yield, and emerging markets debt—enjoyed better relative returns.
Figure 6: Fixed Income Market Performance Returns as of 31 March 2024
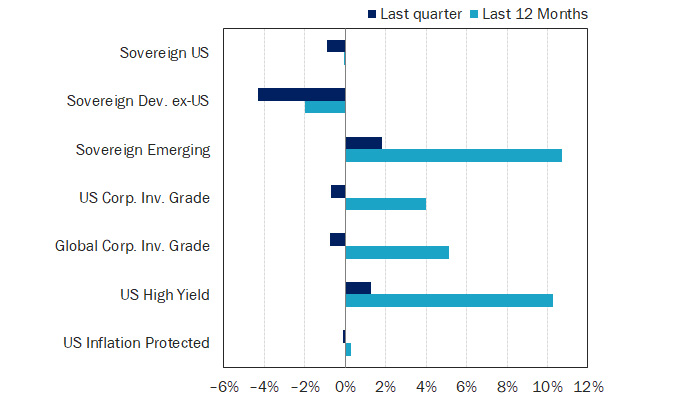
(Source: ICE US Treasuries Core, S&P Int. Sov. ex-US, JPMorgan EMBI Global Core, iBoxx USD Liquid Inv. Grade, Bloomberg Global Agg. Corp., iBoxx USD Liquid High Yield, Bloomberg US Gov. Inflation-Linked All Mat., all expressed in USD, via Bloomberg.)
Inflation was once again squarely in focus, with pretty much every measure of rising prices we’re following showing a worrying stickiness over the first three months of 2024. The Fed, in turn, has gradually pushed a start to easing down its calendar, which becomes more problematic the closer we come to this fall’s U.S. Presidential election. In fact, the Fed might not want to cut rates at that point, considering different scenarios for inflation leading into November, according to which last quarter’s trend puts headline CPI in the range of 4-5%, year-over-year (Figure 7). Our read is that the case for a June cut is almost a lost cause at this point, with one cut by year end seeming to us more likely, and zero cuts certainly conceivable depending on how inflation actually evolves.
Figure 7: Inflation Trending Higher Into November Elections
Although the Fed was founded as an independent agency on the hope its policymaking would be free of politicians' influence, that doesn't stop politicians from accusing the central bank of using its power to influence politics. Such perceptions put the Fed in a difficult spot, as the closer we come to the U.S. Presidential election in November, the harder it gets for the FOMC to begin its easing cycle without triggering claims those cuts are meant to impact the vote. Along these lines, we liked a back-of-the-envelope analysis by Bank of America recently, extrapolating various assumptions for month-over-month inflation into November. That work showed carrying forward a 0.4% monthly increase—merely the average rate observed in Q1—puts year-over-year CPI at 4.4% when voters hit the polls.
Realized US CPI and possible future paths, year-over-year %, Jan. 2020 – Dec. 2024
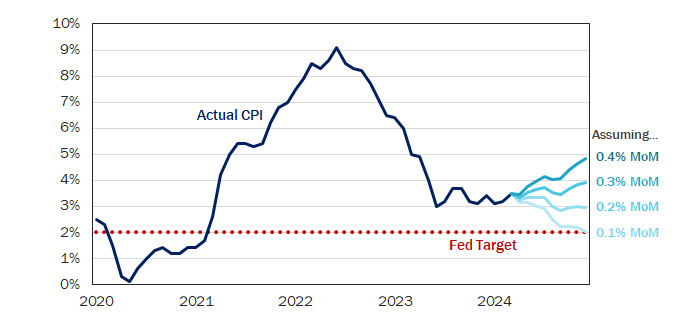
(Source: Rayliant Research, Bank of America, Bureau of Labor Statistics, as of Mar. 31, 2024.)
Even if the U.S. is not ready to make a move, the first quarter witnessed plenty of action happening in monetary policy across the rest of the developed and emerging world. Japan and Turkey were notable central banks hiking in Q1, though in the case of the former it was a bullish signal, while for the latter—whose policy rate ended March at a staggering 50%—it was a desperate attempt to contain inflation that clocked in at 68.5% year-over-year at the end of Q1. Overall, though, global central banks were clearly entering an easing cycle, with more banks lowering than raising rates as inflation has generally trended lower since the pandemic-era price increases that kicked off a massive wave of tightening in the last few years (see Figure 8).
Figure 8: Despite Fed's Hesitation, Central Banks Cutting in '24
The Fed may be on the fence as to when it starts easing, but that hasn't stopped many other central banks around the world from getting cuts underway. A look back at monetary policy cycles going back to the turn of the century shows just how much tightening there was to unwind at the beginning of 2024 after a wave of rate hikes starting in 2021, which aimed to crush pandemic-era inflation. Even as major advanced economies' central banks debate when cuts might commence, many emerging economies—especially those in Latin America, a region with a history of dealing with inflation—had tightened sooner and were able to begin easing in the middle of last year. Whenever the Fed finally loosens up, they will likely be joining a chorus of cuts already in progress.
Net number of rate hikes (cuts) by global central banks, trailing 3 mos., Jan. 2000 – Mar. 2024
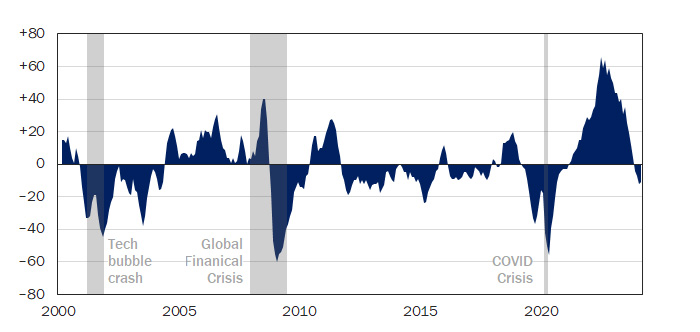
(Source: Rayliant Research, Bank of International Settlements, NBER recessions shaded, as of Mar. 31, 2024.)
Outside of Turkey, that’s been the case in many emerging markets, and even a number of advanced economies like the Eurozone seemed poised to begin easing at some point in the second quarter. Of course, with so much focus on monetary policy, it’s easy to lose sight of the impact fiscal conditions can have on yields. Turning back to the U.S., it strikes U.S. that investors’ anxiety about sustained deficits, especially unlikely to improve in an election year, could be another source of upward pressure on yields (Figure 9).
Figure 9: Little Progress Seen on US Fiscal Deficit This Decade
America's fiscal deficit, the difference between the state's spending and its income, totaled 8.8% of GDP in 2023, up from just 4.1% of GDP the year before, as the government shelled out 1.3 percentage points of GDP more at the same time tax revenues fell by 3.1 percentage points. Economists at the IMF recently warned the situation is unlikely to improve anytime soon, predicting an average fiscal deficit of 6.6% of GDP over the next six years and noting that the country's "fiscal slippage"—especially around an election—poses a risk to both its domestic and the global economy. We see America's fiscal irresponsibility as posing a risk to bond investors, as well, since Treasury issuance required to support excessive spending can only mean greater upward pressure on long-term yields.
Fiscal deficit as % of GDP, actual data from 2002 – 2023, IMF forecasts from 2024 – 2029
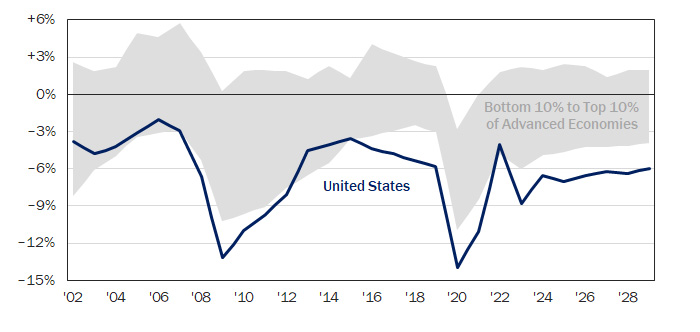
(Source: Rayliant Research, International Monetary Fund, as of Apr. 17, 2024.)
Alternatives
With the expected pace and magnitude of Fed rate cuts slipping throughout Q1, it was unsurprising to see real estate put in a modestly negative quarter, though the big story among alternative assets we’re tracking was in commodities, where a number of sectors were experiencing a pattern reminiscent of late-cycle outperformance sometimes witnessed in the space (see Figure 10). Though a diversified basket of commodities was up a relatively modest 2.2% for the first three months of 2024, a handful of sectors posted remarkable outperformance to start the year.
Figure 10: Alternatives Performance Returns as of 31 March 2024
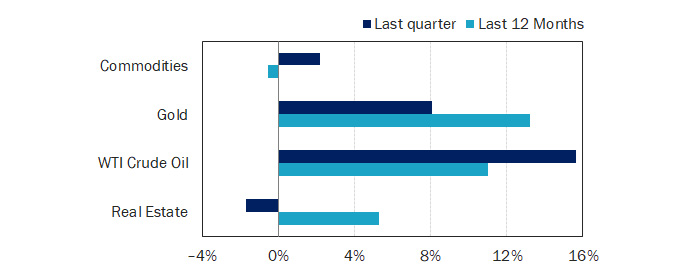
(Source: Bloomberg Commodity Index, Gold Spot, WTI Crude, iShares International Developed Real Estate ETF, all expressed in USD, via Bloomberg.)
Precious metals were a case in point, with gold extending a sharp rally from the prior quarter on growing geopolitical concerns, big purchases by central banks around the world diversifying away from the U.S. dollar, as well as anticipated Fed cuts that would reduce the non-yielding commodity’s negative carry. We find it notable that—similar to what we observed with growth stocks, whose typical inverse relationship to interest rates broke down amidst risk-on exuberance in Q1—gold traders seemed unfazed by rising yields (Figure 11), a potential sign of “overbought” conditions to anyone considering a speculative bet on the rallying commodity.
Figure 11: Gold Investors Shrugging Off Rising Real Treasury Yields
The last few months have been spectacular for gold, with the precious metal hitting record highs as central banks stepped up purchases, diversifying away from the U.S. dollar—March marked a seventeenth straight month of net purchases by the People's Bank of China—and investors sought a safe haven in light of fears conflict in the Middle East could quickly spiral out of control. That said, at least one catalyst for gold's rally at the end of last year seems less relevant today: expectations for Fed rate cuts that would reduce the opportunity cost to holding an asset with no yield. In fact, we see the decoupling of gold's price and real yields as a serious risk factor in a potential reversal of the commodity's recent rally, especially if investors' concerns geopolitical concerns wane in coming months.
Spot gold price vs. real US Treasury yields, Jan. 2003 – Apr. 2024
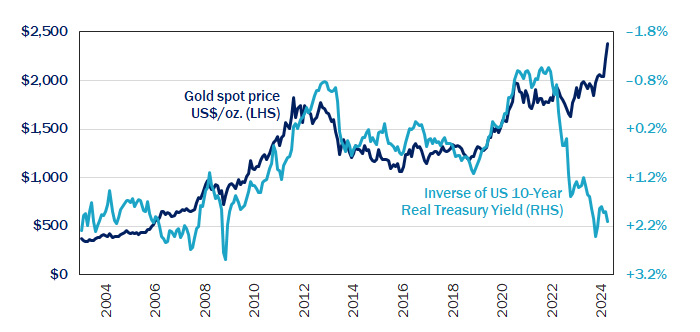
(Source: Rayliant Research, as of Apr. 12, 2024.)
Another sector showing strength in the first quarter was energy, with the price of crude oil climbing by 15.7% through the end of Q1. Here we believe there’s a stronger fundamental case, as tight supply—resulting, in part, from voluntary production cuts by members of the OPEC+ group, initiated in 2022 and extended again in March—meets investors’ fear over disruptions related to Houthi attacks on Red Sea ships and potential broadening of conflict in the Middle East, as well as building optimism, on the other hand, that an economic soft landing will lead energy demand to further recover toward its pre-pandemic growth path (see Figure 12). Though industrial metals were roughly flat for the first quarter, we see it as another sector where supply issues create great potential for outperformance in upside scenarios for the global economy, with China’s return to growth representing yet another catalyst that could push prices higher. Such thinking is the basis for the recent addition of metal mining shares to our diversified global models, where we believe valuations create a compelling entry point. (Insert Figure 12).
Figure 12: Crude Demand Still Tracks Short of Pre-Pandemic Trend
COVID-era restrictions on personal mobility and the disruption to energy prices from Russia's invasion of Ukraine put a damper on oil demand in recent years which has only slowly recovered as the industry worked around issues with Russian supply and people across the globe got moving again post-pandemic. China loomed large on both sides of the shock to demand, with large-scale lockdowns of 2022 giving way to a 2023 re-opening, accounting for more than three-quarters of the bounce back in consumption for the year. Oil bears suggest the rise of EV and a broader new energy transition will keep oil demand from resuming its pre-pandemic trajectory. Even so, we think tight supplies, coupled with China's return to growth and geopolitical factors could combine to keep prices high.
World oil demand, millions of barrels per day, along with pre-pandemic trend, 1980 – 2023
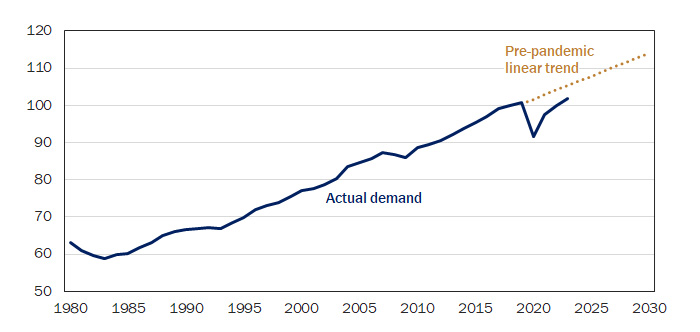
(Source: Rayliant Research, US Energy Information Administration, trend calculated from 2000 – 2019.)
Economic Calendar
Key Economic Releases and Events for the United States – 2024 Q2
FOMC Rate Decision: 1st May, 12th Jun.
GDP Figures: 25th Apr., 30th May, 27th Jun.
PMI Figures: 1st May, 3rd Jun.
CPI Figures: 15th May, 12th Jun.