JULY 22, 2022 | Rayliant
(Photo credit): Gettyimages.com/Samuel Corum/Stringer
We review the fight against inflation, its effect on the economy and markets, and where things might be headed in the second half.
Rayliant Global Advisors is a global investment manager with offices in Los Angeles, London, Hong Kong, Hangzhou and Taipei. With over US$15-billion in assets linked to Rayliant's strategies, its clients include some of the world's largest sovereign wealth funds, pension plans, and other institutional investors. Rayliant's award-winning team is an independent advisor to East West Bank regarding global economies and markets.
By the close of the second quarter, investors' attention had shifted from Russia's continued assault on Ukraine-the ramifications of which dominated financial markets and headlines at the end of Q1-to the Fed's escalating battle against inflation. Powell's June salvo in that fight, a 75-basis-point hike in the central bank's policy rate, ratcheted up fears of a recession (we may be in one already) and sent prices of most assets sliding to new lows. Below, we share with you some of the themes and data the team at Rayliant has been tracking as we process a tumultuous Q2 and enter the second half.
Asset Classes
Equities
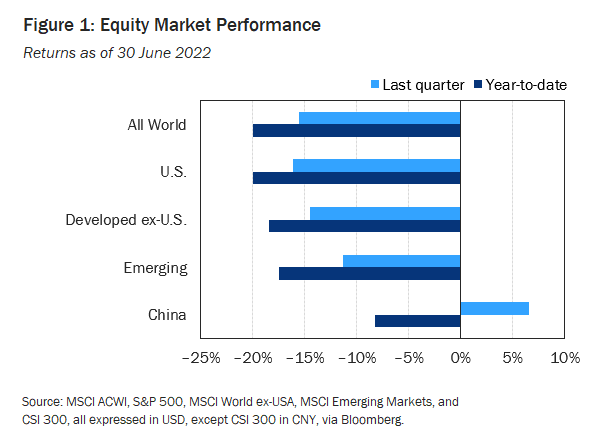
Stocks were in the red almost across the board in Q2 (see Figure 1), falling on deepening concern that unabating inflation observed in major markets around the world would prompt the Fed-fighting what chair Jerome Powell called an 'unconditional' battle against rising prices-and other central banks to overshoot and send the global economy into a recession. U.S. stocks were sharply lower, down -16.1% for the quarter. UK equities, whose sector composition is naturally somewhat defensive, suffered less, declining by -5%, while European shares, disproportionately affected by Russia's continued attack on Ukraine, lost -5.7%. Emerging market stocks declined by -11.3%, as US dollar strength and the threat of a downturn in global trade weighed on developing economies. China was a notable exception, with mainland-listed shares actually adding +6.5% in Q2, as lockdowns eased and policymakers aggressively shifted to an accommodative stance, reversing course on regulatory interventions in the country's tech sector and beginning to ramp up monetary and heavy fiscal stimulus.
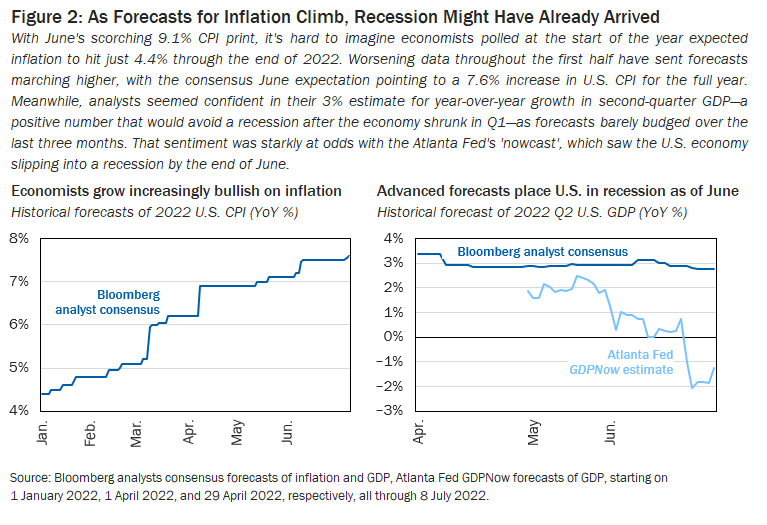
The driving force behind declining stocks during the quarter seemed to be investors' slow recognition of the seriousness of inflationary pressures, as U.S. headline CPI dipped slightly in April, from 8.5% to 8.3%, before posting progressive increases to 8.6% and 9.1%, respectively, in May and June, the latter marking the worst year-over-year jump in prices in over four decades. In fact, economists surveyed by Bloomberg at the beginning of the year had much rosier expectations for inflation in 2022, imagining CPI would fall to just 4.4% at year end-an optimism which had faded by late-June, when those polled put full-year inflation at 7.6% (see Figure 2, left). Although analysts' predictions for second-quarter U.S. GDP were surprisingly stable, hovering around 3% throughout the quarter, the Atlanta Fed's GDPNow forecast-based on a mathematical model incorporating data on 13 subcomponents of GDP, ranging from residential investment to changes in private inventories-was showing an economic contraction for the second straight quarter by June end (see Figure 2, right).
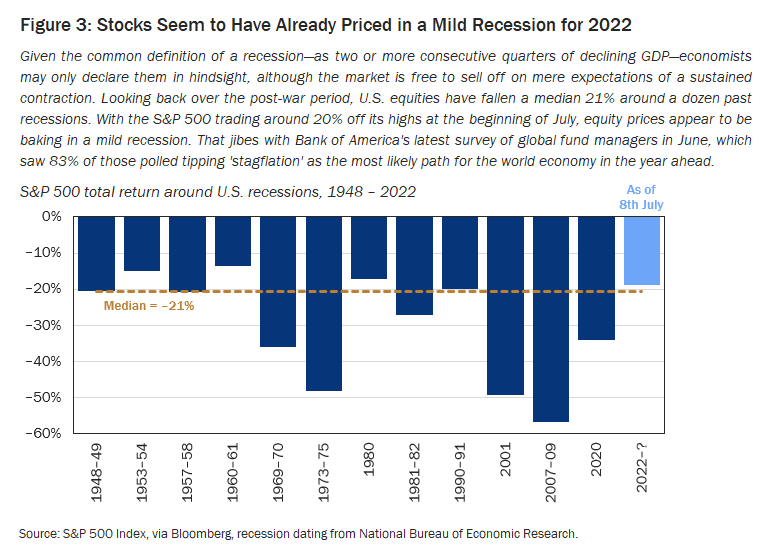
Of course, two quarters of declining GDP is the conventional definition of a recession. What might that look like for stocks? In nearly eight decades of post-war economic history, there have been twelve U.S. recessions (see Figure 3). Market declines around significant contractions in GDP have ranged from a -57% plunge in the S&P 500 amidst the Global Financial Crisis to a less severe -14% drop triggered by a fairly average downturn beginning in 1960-which then-Vice President Richard Nixon blamed for his election loss to John F. Kennedy, perhaps hinting at political changes to come in the aftermath of a potential hard landing under Biden's watch. Judging by the median retreat of -21% around past recessions, the current drawdown effectively prices a middle-of-the-road recession into shares as of the beginning of July.
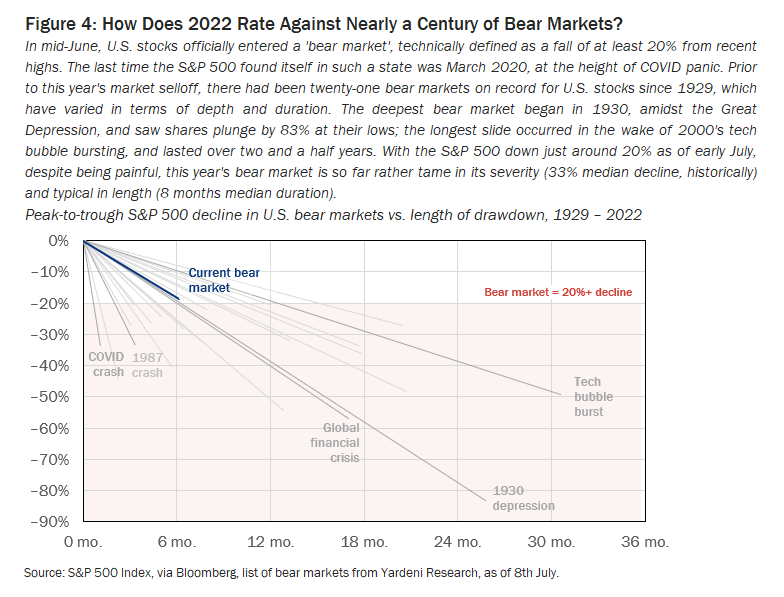
On the topic of price declines, having already breached the -20% threshold required to achieve 'bear market' status, equities present another interesting sample for investors to inspect as they consider how bad things might get: a set of twenty-one bear markets since stocks crashed in 1929 (see Figure 4). Against that long historical record, current weakness in stocks rates as relatively mild, with bear markets typically bottoming out around ten percentage points lower than where we find ourselves at present. The precedent set by past stock market slides seems to warrant continued caution for those inclined to agree with the 83% of global fund managers polled by Bank of America in June who saw 'stagflation' as the most likely outcome for the world economy over the next twelve months.
Fixed Income
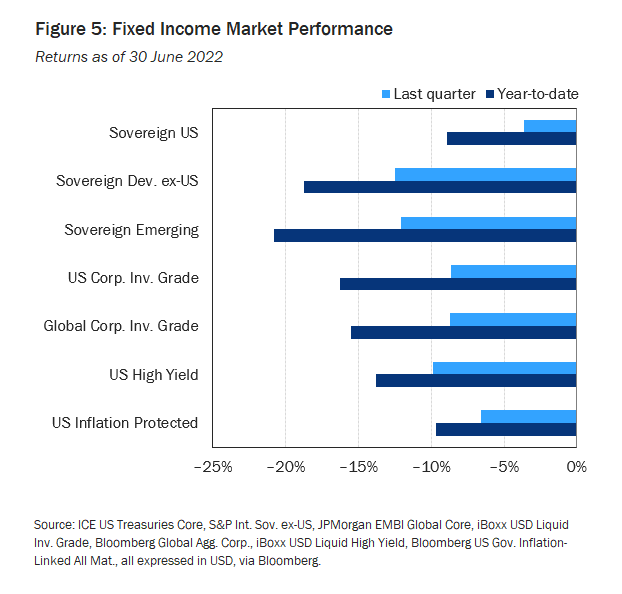
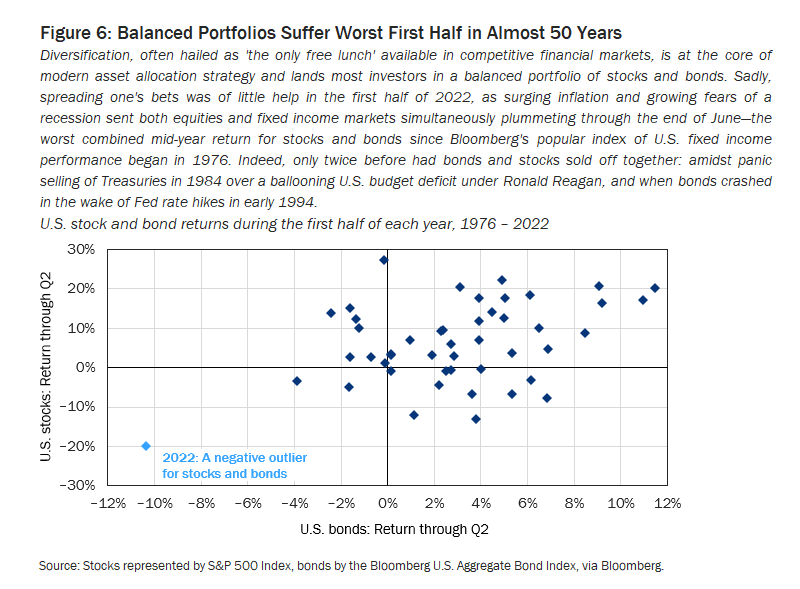
Central banks maintained a hawkish stance in Q2, as inflation continued to hit multi-decade highs in major economies across the globe. The Fed contributed a 75-basis-point hike at its June meeting-its most aggressive move since 1994-following quarter- and half-point increases to the bank's policy rate in March and May, respectively. Accelerated tightening had the expected effect on bonds, with rising yields sending prices sharply lower, as falling fixed income markets gave sliding stock indices a run for their money (see Figure 5). Indeed, plotting stock and bond returns together provides a stark view of just how difficult the current market has been for even the most rationally diversified investors, with the simultaneous sell-off in equities and fixed income through the end of June marking the worst combined performance for the two asset classes at mid-year since Bloomberg's Aggregate Bond Index began tracking fixed income performance in 1976 (see Figure 6). Action in the Treasury term structure during Q2 helps to explain this year's correlation in losses on stocks and bonds, with an inversion in the yield curve that began in March reaching its steepest level in over two decades, implying rates will rise much more aggressively in the short run (bad for bonds), ultimately triggering a recession (bad for stocks) that will inevitably send longer-run rates diving back down as the Fed reverts to easing.
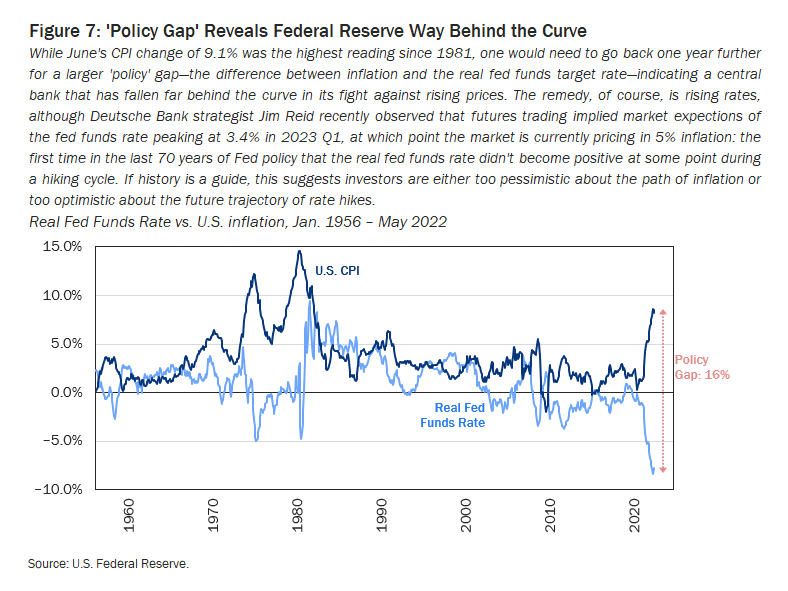
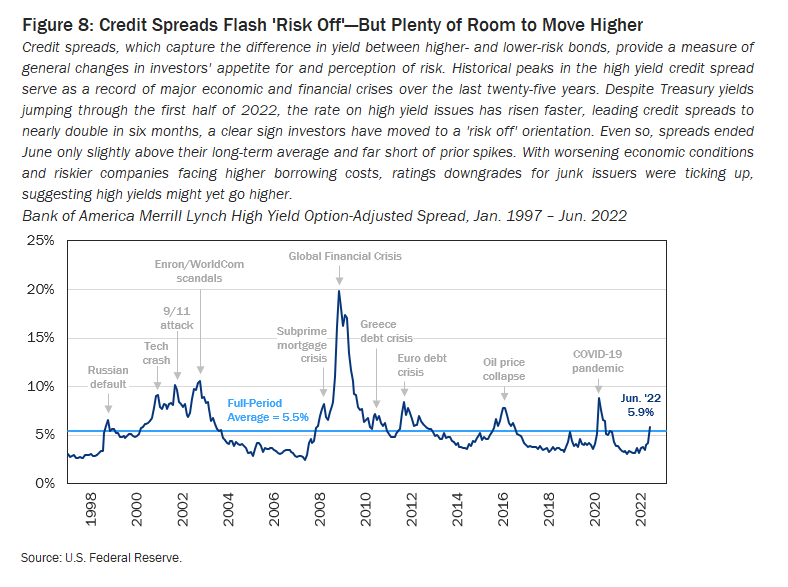
Yields are spiking at the short end of the curve with good reason, as June's shockingly high 9.1% CPI prompted Fed officials to signal support for more supersized rate moves, leading traders in Fed Funds futures to push the odds of a staggering 100-basis-point hike at the next FOMC meeting to nearly 80%, before settling back down to a 45% implied probability. With target rates so low for so long and inflation simmering over the last year, the Fed and other central banks are feeling increased pressure to address a growing 'policy gap': the difference between inflation and an economy's real target rate (see Figure 7). Unfortunately, as Deutsche Bank strategist Jim Reid aptly notes, the same Fed Funds futures show rates peaking at 3.4% in 2023 Q1, while the market is currently pricing in 5% inflation, which would mark the first time in 70 years that a tightening cycle ended without the real fed funds turning positive. That suggests investors are either overestimating future inflation or underestimating how aggressively the Fed will need to raise rates to get climbing prices under control. Optimism as to the likelihood of a soft landing might explain why credit spreads, despite climbing so far this year, are only slightly above their historical average (see Figure 8), making for a less compelling risk-return trade-off, which could get much better if conditions in the economy get much worse.
Alternatives
Even among liquid alternatives-often a strong source of diversification and the asset class offering portfolios the greatest support in the prior quarter-investors found no shelter in Q2, as both real estate and commodities posted negative returns (see Figure 9). Developed real estate led the way down, with REITs falling -16.7% in Q2, underperforming broad equities. While rising rates have prompted real estate investors to hit the exit in recent months, including a record outflow of $2.2 billion from REITs in a single week prior to the Fed's May meeting, it is worth noting that REIT fundamentals remain strong, property market conditions today bear little resemblance to those prevailing ahead of the subprime mortgage crisis that preceded the last serious recession, and real estate remains one of the few asset classes that should weather future inflation well, as rents increase in step with rising prices.
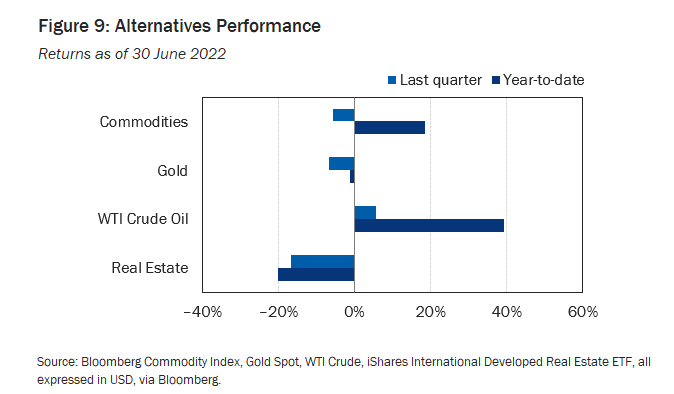
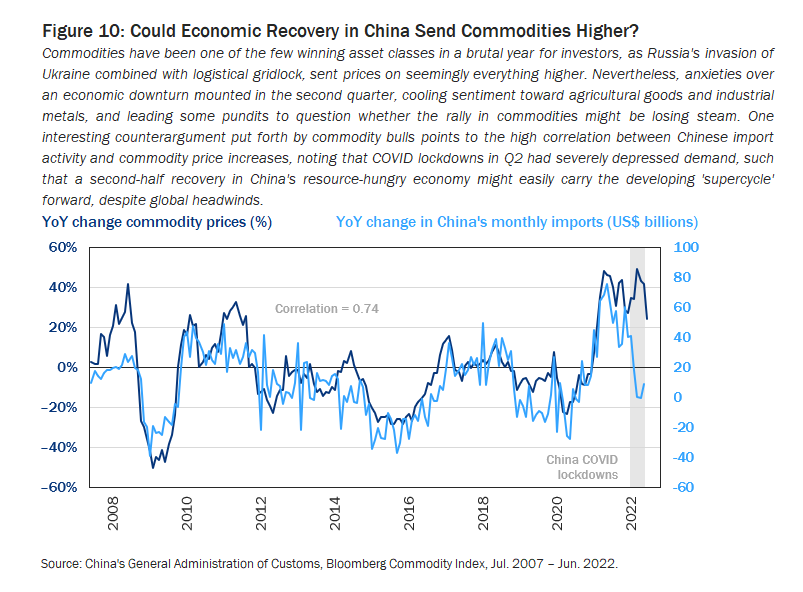
After posting stellar returns in Q1, commodities sold off through the end of June, losing -5.7% for the quarter, but still placing them up 18.4% year-to-date. As the Russian invasion of Ukraine dragged on, energy prices remained elevated, although risk to demand from a cooling global economy put pressure on most other commodity sectors, particularly vegetable oils-a sector sensitive to biofuel demand and for which many commodities happened to experience better-than-expected growing conditions in Q2-and industrial metals, including tin, aluminum, and nickel, down an average of -26% for the quarter, based on data from the World Bank. One narrative heard within the commodities space over the last few years concerns the role demand from China has played in pushing up prices in what some believe represents the beginning of a 'supercycle' in the asset class. Data on the relationship between China's appetite for raw materials and commodity prices do show a strong relationship, with decoupling in the last few months, as COVID lockdowns temporarily suppressed demand (see Figure 10). A second-half recovery for the world's second-largest economy on the back of what we expect will be large stimulus, including heavy infrastructure spending could put upward pressure on prices in the months ahead.
Economic Calendar
Key Economic Releases and Events for 2022 Q3
United Kingdom
Bank of England Official Bank Rate Release: 4th Aug., 15th Sep.
GDP Figures: 12th Aug., 30th Sep.
PMI Figures: 22nd Jul., 1st Aug., 23rd Aug., 1st Sep., 23rd Sep.
Eurozone
ECB Monetary Policy Meeting: 21st Jul., 8th Sep.
GDP Figures: 29th Jul., 17th Aug., 7th Sep.
PMI Figures: 22nd Jul., 1st Aug., 23rd Aug., 1st Sep.
United States
FOMC Rate Decision: 27th Jul., 21st Sep.
GDP Figures: 28th Jul., 25th Aug., 29th Sep.
PMI Figures: 22nd Jul., 1st Aug., 23rd Aug., 1st Sep., 23rd Sep.
This article is provided by third parties (non-affiliates of East West Bank), and/or links to other websites. East West Bank does not endorse or make any warranties, express or implied, regarding any third-party information or any links to other websites. Moreover, East West Bank assumes no responsibility for the accuracy, completeness, reliability or suitability of the information provided by third parties or information, software (if any), offers or activity found on other websites that may be linked to the article. East West Bank will not provide or be responsible for any tax or advisory services and/or legal information service given from the article. You should consult your own legal and/or tax advisors.

